
Working with Kubernetes means there is always something new to learn. It also means that nothing is as simple as it may seem. Resource allocation is the perfect example. If a pod needs 8 GiB of memory is being scheduled on a node with 32 GiB of RAM, most teams expect that they will be able to fit 4 instances of that pod on the node. They are surprised that this isn’t the case. It turns out that there’s a lot more to the story of how Kubernetes allocates resources.
Understanding Kubernetes
Kubernetes is a general purpose computing orchestrator. That is, it is responsible for executing workloads on a cluster of machines. It does this by evaluating what each workload requires and then finding a machine that can meet those requirements. Each container is nothing more than a process running on a machine, no different conceptually from any other executable. The difference is that the container is constrained to some amount of memory and CPU resources. Permissions and APIs are used to isolate network and file system access, ensuring pods see only what they need to see.
When a Kubernetes node starts, it needs to run some executables that set up all of these features. It also needs to make itself available to be managed by the control plane. The process of setting up these components and registering with Kubernetes needs a small amount of time. This is why autoscaling nodes isn’t instantaneous.
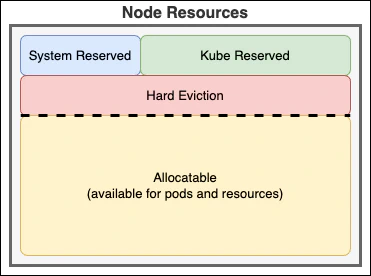
After connecting, Kubernetes will evaluate the resources and constraints on the node, then assign some core workloads. This includes any daemonsets, storage and network providers, monitoring, and any other core services that are needed. These consume CPU, memory, and disk I/O bandwidth. Because these components are required by the node (and supported by the underlying operating system), Kubernetes needs to ensure that they always have guaranteed resources that can’t be preempted by other workloads. These resources are said to be “reserved”. This is configured by the kubelet application on the node. Resources are reserved for the system (OS) and the Kubelet (Kubernetes components).
About reservations
There are a few ways that Kubernetes reserves resources. The first is by setting the
--kube-reserved flag to reserve resources for the system components. This reserves resources for the non-pod Kubernetes components, such as kubelet and the container runtime. Without this, critical Kubernetes features could run out of essential resources. The amount of resources being reserved is usually related to the number of pods that will be running on the node.
Of course, it’s important to make sure the operating system also has enough resources. Setting
systemReserved reserves resources for operating system components. This includes udev, sshd, login sessions, and the kernel itself.
Finally, there needs to be a safety margin. If the system runs too low on memory or CPU, the entire node is impacted. To avoid system-level issues, the
evictionHard threshold can be used to preserve the node’s stability. When the system reaches this threshold, the node will start evicting pods to ensure the system components have enough resources to continue running. Generally speaking, most providers set the eviction threshold to 100 MiB of memory, 10% of the file system, 5% of the inodes, and 2000 process IDs (pids). Dropping below any of these thresholds will trigger an eviction. You want to avoid that. 😄
These reservations are configured when each node is created and are not adjustable after the node is running. In the cloud, these are managed by the cloud provider. Any resources not reserved by one of these mechanisms are considered “allocatable”. This is the pool of resources that can be used by pods.
Supporting services
Our story doesn’t end here. After that, we can now allocate pods and other resources that are managed by Kubernetes. These resources are responsible for managing how your pods interact with each other and the outside world. This includes components that the cloud providers may include for monitoring or additional configuration. Some of the typical components include coredns, kube-proxy, and the CSI and CNI drivers.
These services, containers, and reservations help explain why the full node is not available to your workloads. There are a lot of workloads already running to support Kubernetes and the workloads it hosts.
The cloud story
Each cloud provider has a different way of calculating their resource reservations. Google provides documentation on their calculations. Azure also details their Kubernetes reservations. I haven’t found the same documentation with Amazon, but their script documents their reservations. In addition, each provider includes their own services and monitoring.
It’s important to know that Windows automatically requires an additional 2GB memory reservation in addition to any other reservations. Unfortunately, Kubernetes cannot automatically track this today on Windows. To avoid overcommitment, you should manually account for this.
Exploring the node
Let’s see how we can apply what we know and explore a vanilla Kubernetes deployment. To illustrate this, I’ll use Azure Kubernetes Service, but these techniques work for any Kubernetes environment. First, let’s find out what nodes are available:
1kubectl get nodeThis command returns a list of nodes in the cluster.
1NAME                              STATUS   ROLES   AGE   VERSION
2aks-arcpool-36126072-vmss000000   Ready    agent   11m   v1.29.5
3aks-syspool-18801395-vmss000000   Ready    agent   14m   v1.29.5
Choosing any one node, we can query it see what the node is configured to use and how much of that is actually available. The jq tool can then filter the results to just the fields of interest.
1kubectl get node aks-arcpool-36126072-vmss000000 -o json | jq '{ allocatable:.status.allocatable, capacity:.status.capacity }'The results make it easy to see that the node has 4 CPU nodes (4000 millicores) and 16 GIB of memory. Of that, 3,860 millicores and 12.28 GiB of memory are available. In addition, the node is configured to support 80 pods.
 1{
 2  "allocatable": {
 3    "cpu": "3860m",
 4    "ephemeral-storage": "119703055367",
 5    "hugepages-1Gi": "0",
 6    "hugepages-2Mi": "0",
 7    "memory": "12879640Ki",
 8    "pods": "80"
 9  },
10  "capacity": {
11    "cpu": "4",
12    "ephemeral-storage": "129886128Ki",
13    "hugepages-1Gi": "0",
14    "hugepages-2Mi": "0",
15    "memory": "16373528Ki",
16    "pods": "80"
17  }
18}
Finding the memory
Want to understand what’s using these resources? To do that, you need to know how the kubelet was configured and what is being reserved. There are two approaches that can provide this information.
The first approach relies on using the APIs to read the node details. To begin, run kubectl proxy --port=8080 to proxy requests to the API server. Next, run curl -X GET http://127.0.0.1:8080/api/v1/nodes/aks-arcpool-36126072-vmss000000/proxy/configz | jq. This returns the node’s configuration, which includes some important details:
 1{
 2  "kubeletconfig": {
 3   ︙
 4    "evictionHard": {
 5      "memory.available": "100Mi",
 6      "nodefs.available": "10%",
 7      "nodefs.inodesFree": "5%",
 8      "pid.available": "2000"
 9    },
10   ︙
11    "kubeReserved": {
12      "cpu": "140m",
13      "memory": "650Mi",
14      "pid": "1000"
15    },
16    ︙
17  }
18}
The node is configured to reserve 140 millicores of CPU and 650 MiB of memory. That matches the memory and CPU allocations we saw earlier. This confirms that the missing resources are the result of the configured reservation. In addition, the node is configured to evict pods if the memory drops below 100 MiB. That means that there’s actually a total of 750 MiB that is unavailable to the pods.
In addition, this confirms that 10% of the root disk is also unavailable. If the node is using a 127 GiB ephemeral disk, pods are evicted when less than 12.7 GiB is available. That doesn’t include storage used by the operating system. The remaining storage can be used for the container images and the running pod containers.
Finding the allocations
To really understand the node, it’s important to understand what pods are automatically allocated on the cluster. The kubectl describe command can be used.
1kubectl describe node aks-arcpool-36126072-vmss000000This returns a lot of data. This data includes the details about the pods that are running and their resource consumption.
 1Non-terminated Pods:          (9 in total)
 2  Namespace                   Name                                 CPU Requests  CPU Limits  Memory Requests  Memory Limits  Age
 3  ---------                   ----                                 ------------  ----------  ---------------  -------------  ---
 4  kube-system                 azure-ip-masq-agent-4jmx5            100m (2%)     500m (12%)  50Mi (0%)        250Mi (1%)     87s
 5  kube-system                 azure-npm-8vngw                      250m (6%)     250m (6%)   300Mi (2%)       1000Mi (7%)    87s
 6  kube-system                 cloud-node-manager-4xjxf             50m (1%)      0 (0%)      50Mi (0%)        512Mi (3%)     87s
 7  kube-system                 coredns-6745896b65-5qrlf             100m (2%)     3 (77%)     70Mi (0%)        500Mi (3%)     43s
 8  kube-system                 csi-azuredisk-node-mk9j8             30m (0%)      0 (0%)      60Mi (0%)        400Mi (2%)     87s
 9  kube-system                 csi-azurefile-node-zjmws             30m (0%)      0 (0%)      60Mi (0%)        600Mi (4%)     87s
10  kube-system                 konnectivity-agent-fc4d855f-qssf6    20m (0%)      1 (25%)     20Mi (0%)        1Gi (7%)       48s
11  kube-system                 kube-proxy-7xxk6                     100m (2%)     0 (0%)      0 (0%)           0 (0%)         87s
12  kube-system                 metrics-server-595bf6d9cd-lnnth      51m (1%)      146m (3%)   93Mi (0%)        363Mi (2%)     47s
13
14Allocated resources:
15  (Total limits may be over 100 percent, i.e., overcommitted.)
16  Resource           Requests    Limits
17  --------           --------    ------
18  cpu                731m (18%)  4896m (126%)
19  memory             703Mi (4%)  4649Mi (32%)
20  ephemeral-storage  0 (0%)      0 (0%)
21  hugepages-1Gi      0 (0%)      0 (0%)
22  hugepages-2Mi      0 (0%)      0 (0%)
The components that are pre-configured on this cluster consume an additional 731 millicores and 703 MiB of memory, with an upper limit of 4896 millicores and 4,649 MiB of memory. Combining these together, that means the system has 11.87 GiB of memory and 3,129 millicores available for scheduling. There’s also 100 MiB of memory configured as an eviction limit, so the best case scenario is 11.77 GiB of allocatable memory. At the same time, the system components could request all of the available cores use up to half of the physical memory.
That doesn’t leave much room for other workloads. This why 4-core Kubernetes systems are rarely recommended. This cluster has already lost 25% of its CPU and memory capacity to reservations and services. In addition, system components are configured with a limit that exceeds the available capacity, meaning the node could end up overcommitted.
Next steps
Understanding how the node resources are consumed makes it easier to plan the capacity of your cluster. By exploring the resources available for allocation, it becomes possible to plan how many pods can potentially be scheduled on a given node. It is possible to predict some of these allocations to be able to proactively plan the cluster. As you’ve already seen, there are two keep considerations: the reservations and the pod allocations. Each provider has a standardized approach to defining the reservations. If you understand the approach, you can estimate what should be available. I’ll explore that more in the next post.